


Abstract
The prevalence of bacteria, parasite and viral pathogens in 3875 patients with diarrhea in community and hospital settings from March 1997 through August 1999 in Jakarta, Indonesia was determined using routine bacteriology and molecular assay techniques. Bacterial pathogens isolated from hospital patients were, in decreasing frequency, Vibrio cholerae O1, Shigella flexneri, Salmonella spp. and Campylobacter jejuni, while S. flexneri, V. cholerae O1, Salmonella spp. and C. jejuni were isolated from the community patients. V. cholerae O1 was isolated more frequently (P<0.005) from the hospital patients than the community patients. Overall, bacterial pathogens were isolated from 538 of 3875 (14%) enrolled cases of diarrhea. Enterotoxigenic Escherichia coli were detected in 218 (18%) of 1244 rectal swabs. A small percentage of enterohemorrhagic E. coli (1%) and of Clostridium difficile (1.3%) was detected. Parasitic examination of 389 samples resulted in 43 (11%) positives comprising Ascaris lumbricoides (1.5%), Blastocystis hominis (5.7%), Giardia lamblia (0.8%), Trichuris trichiura (2.1%) and Endolimax nana (0.5%). Rotavirus (37.5%), adenovirus (3.3%) and Norwalk-like virus (17.6%) were also detected. Antimicrobial resistance was observed among some isolates. Bacterial isolates were susceptible to quinolones, with the exception of some isolates of C. jejuni which were resistant to ciprofloxacin, nalidixic acid and norfloxacin. Data obtained from this community- and hospital-based study will enable the Indonesian Ministry of Health to plan relevant studies on diarrheal diseases in the archipelago.
1 Introduction
Diarrheal disease is a major cause of mortality and morbidity in developing countries [1]. Worldwide, an estimated 4–5 million children and adults die annually of infectious diarrhea [2]. In Indonesia, household surveys revealed that diarrheal disease was the third leading cause of morbidity, with a morbidity rate of 7.8 per 1000 per year from 121,266 people surveyed [3]. In addition, diarrheal disease in Indonesia was the leading cause of death in infants, causing 24.1% of all infant deaths and 40% of all deaths in the first 2 years of life [4]. These statistics are likely to be underestimates as many patients do not have access to the limited number of hospitals and health centers that are available.
Knowledge of the etiology of acute diarrhea is relevant for planning diarrheal disease control strategies. In Indonesia, health services are provided to people throughout the Indonesian archipelago through Pusat Kesehatan Masyarakat or Community Health Centers (CHC), which are available in each province, district, subdistrict and small village. The CHC, which is subsidized by the government, consists of a general diseases clinic for outpatients, a child and maternity clinic, and a health education section. Since health consultation and treatment are costly, the majority of people in Indonesia prefer going to the CHC, especially for illnesses that are not life threatening. Patients with non-secretory diarrhea, who pass fewer than 5–8 stools within 24 h, usually do not go to hospitals, but to the CHC instead. As a result, certain bacterial infections that cause mild diarrhea or a non-choleric type of gastroenteritis may be found more prevalent in the CHC than in hospitals. Understanding this difference may be important for the Indonesian government in planning health service programs for a CHC, particularly in providing drugs for diarrhea. In Indonesia, it is believed that bacterial infections occur more frequently among children than adults and that only severe cases of diarrheal disease present themselves to the hospitals. Current laboratory methods used to detect and identify enteric pathogens such as Shigella spp. and Salmonella spp. in public health laboratories are lacking; routine bacterial culture techniques are not performed because of cost. Therefore, most of the CHCs treat patients with antibiotics without definitive laboratory results. The types of etiology of diarrheal disease in Indonesia are not well defined. Usually, for Campylobacter treatment in Indonesia, erythromycin is used. For Salmonella spp. and Shigella spp., sulfamethoxazole–trimethoprim is used, while for cholera, tetracycline is used. Quinolones are not commonly used for the treatment of diarrheal infections because they are expensive to purchase. For parasitic treatment, metronidazole is used.
Recent reports from different parts of the world showed varying frequencies of bacterial agents of diarrhea [5–7]. In Indonesia, studies on the etiological agents associated with diarrheal disease in a community and hospital setting have not been studied in parallel. This study was initiated to determine the association of these etiologic agents with endemic diarrhea, and the spectrum of bacteria causing infection. In addition, the prevalence of the organisms isolated and their susceptibility pattern to antibiotics were evaluated.
2 Materials and methods
2.1 Subjects and specimen collection
During the period of March 1997 through August 1999, a diarrheal disease study was conducted among patients reporting for diarrhea. The study sites involved were three hospitals (Harapan Kita, Sumber Waras and Friendship) and three CHCs (Cilincing, Tanjung Priok, and Pejaringan) in North Jakarta, Indonesia. Regardless of the age of the patients and the severity of illness (mild, moderate or severe), the participating hospital and CHC staff were instructed to obtain stool or rectal swab samples from each diarrhea patient on the day of admission or presentation, before antibiotic was given. Diarrhea was defined as three or more loose stools in the previous 24 h for less than 72 h. Personal data and symptoms of the illness including the type of diarrhea were obtained. A control group consisting of patients reporting for cases other than diarrhea was included. Following informed consent for children and adults, the diarrheic and the control groups were enrolled for the study. Specimens were transported to the Naval Medical Research Unit No. 2 (NAMRU-2) laboratory in Cary-Blair (BBL) within 4 h of collection and processed immediately. Specimens obtained in the evening or at night were kept in the refrigerator at 2–8°C and transported in a cool box the following day.
This study was reviewed and approved by the NAMRU-2 Committee for the Protection of Human Subjects, and by the Indonesian Ministry of Health Research and Development Ethics Committee. Voluntary, written, informed consent was obtained from the participants or parent or guardian (in pediatric cases), prior to enrollment in this study.
2.2 Laboratory processing
Upon arrival at the NAMRU-2 laboratory, rectal swabs with samples were inoculated directly onto MacConkey (MAC) agar, Salmonella–Shigella (SS) agar, Campylobacter blood agar (CAB) and thiosulfate citrate bile sucrose (TCBS) agar. One of the two swabs was placed into mannitol selenite enrichment broth (MSB) for Salmonella enrichment and the other into alkaline peptone water (APW) for Vibrio enrichment. Agar plates (except CAB plates) and broth tubes were incubated under aerobic conditions at 37°C for 18–20 h. CAB plates were incubated under microaerophilic conditions with oxygen concentration reduced to 3–5% using GasPak 150 Large Anaerobic System (BBL Microbiology Systems, Sparks, MD, USA) and CampyPak Plus (BBL Microbiology systems), at 42°C for 48–72 h. Cultures in MSB were inoculated onto SS agar and those in APW onto TCBS plates. Plates were incubated at 37°C, aerobically for 18–20 h. Non-lactose fermenting colonies of Salmonella and Shigella grown on MAC and SS agar plates, and colonies on TCBS resembling those of Vibrio spp. were selected and tested for their biochemical reactions on Kligler's iron agar, sucrose semisolid agar and motility–indole–ornithine [8–10]. It was difficult to obtain stool specimens in all the reported cases of diarrhea from the patients. Therefore, all the stool specimens obtained instead of rectal swabs from patients with diarrhea were additionally screened for parasitic and viral pathogens. Parasitic examination was performed by the method of Melvin and Brooke [11]. GM1-ELISA for detecting enterotoxigenic Escherichia coli (ETEC) was undertaken according to Svennerholm et al. [12]. Rotavirus analysis was conducted using Rotazyme Kits (Abbott Laboratories, Chicago, IL, USA). Norwalk and Norwalk-like virus testing was performed according to Ando et al. [13]. Enterohemorrhagic E. coli (EHEC) detection was performed using Premier EHEC (Meridian Diagnostic Inc., Cincinnati, OH, USA) and Clostridium difficile detection was performed using Premier C. difficile Toxin A (Meridian Diagnostic Inc., Cincinnati, OH, USA). Antimicrobial susceptibility of the isolates was performed by the disk diffusion test of Bauer et al. [14] employing ampicillin, sulfamethoxazole–trimethoprim, chloramphenicol, tetracycline, cephalothin, ceftriaxone, colistin, kanamycin, neomycin, erythromycin, nalidixic acid, norfloxacin and ciprofloxacin.
2.3 Statistics
Chi-square and Fisher's exact tests were used to compare differences between the groups. A P-value of <0.005 was considered to be significant.
3 Results
A total of 3875 patients with diarrhea reported to the hospitals and CHCs for treatment. Of this number, 1990 diarrhea cases were from the hospital and 1885 from the CHCs. The prevalence rates of the various pathogens detected from community and hospital settings with and without diarrhea are presented in Tables 1a, 1b and 2. There were higher rates of isolation of all diarrheagenic agents studied from patients with diarrhea than from controls (P<0.005). The isolation rate for Vibrio cholerae O1 was significantly higher (P<0.005) in the hospital setting as compared to the community setting. For patients with diarrhea who reported to the hospital, V. cholerae O1 145 (7.3%), Shigella spp. 88 (4.4%), Salmonella spp. 108 (5.4%) and Campylobacter spp. 10 (0.5%) were isolated most frequently, while Shigella spp. 63 (3.3%), V. cholerae O1 49 (2.6%), Salmonella spp. 26 (1.4%) and Campylobacter spp. 20 (1.1%), were isolated from the community patients. Overall, bacterial pathogens were detected in 538 of 3875 (14%) reported cases of diarrhea. Of the 538 positive cases, 372 (69.1%) were from the hospital setting, whereas 166 (30.9%) patients were community associated. There was a significant difference (P<0.005) between the rate of isolation of pathogens from the hospital (372/1990 (18.7%)) and community (166/1885 (8.8%)) case subjects. Single pathogens were isolated from most stool samples of patients with diarrhea as well as from controls in both community and hospital groups. More pathogens were isolated from the control patients without diarrhea who reported to the hospital when compared to the community control patients (Tables 1a and 1b).
Etiological agents isolated from patients with diarrhea cases and controls in hospitals and CHCs (%)
>14 years old.
0–14 years old.
Etiological agents isolated from patients with diarrhea cases and controls in hospitals and CHCs (%)
>14 years old.
0–14 years old.
Percentage of age distributions of diarrheic patients and controls in hospitals and CHCs
| Isolates | Number positive/age (year) | |||||||||||
| Hospital: number positive (%) | Community: number positive (%) | |||||||||||
| Cases | Controls | Cases | Controls | |||||||||
| 0–1 (n=676) | >1–5 (n=365) | >5–14 (n=158) | >14 (n=791) | <14 (n=507) | >14 (n=275) | 0–1 (n=424) | >1–5 (n=737) | >5–14 (n=218) | >14 (n=506) | <14 (n=140) | >14 (n=196) | |
| Vibrio cholerae O1 | 10 (1.5) | 5 (1.4) | 5 (3.2) | 125 (15.8) | 5 (1.0) | 4 (1.5) | 12 (2.8) | 15 (2.0) | 5 (2.3) | 17 (3.4) | 0 | 2 (1.0) |
| V. cholerae non-O1 | 0 | 0 | 0 | 4 (0.5) | 0 | 1 (0.4) | 0 | 0 | 0 | 0 | 0 | 0 |
| Vibrio parahaemolyticus | 1 (0.1 | 0 | 0 | 3 (0.4) | 0 | 0 | 0 | 0 | 1 (0.5) | 2 (0.4) | 0 | 1 (0.5) |
| Shigella flexneri | 5 (0.7) | 6 (1.6) | 3 (1.9) | 59 (7.5) | 1 (0.2) | 4 (1.5) | 9 (2.1) | 15 (2.0) | 3 (1.4) | 23 (4.5) | 0 | 0 |
| Shigella sonnei | 4 (0.6) | 3 (0.8) | 1 (0.6) | 4 (0.5) | 0 | 1 (0.4) | 1 (0.2) | 5 (0.7) | 1 (0.5) | 2 (0.4) | 1 (0.7) | 0 |
| Shigella dysenteriae | 0 | 0 | 0 | 3 (0.4) | 0 | 0 | 0 | 1 (0.1) | 1 (0.5) | 2 (0.4) | 0 | 0 |
| Campylobacter jejuni | 4 (0.6) | 2 (0.5) | 1 (0.6) | 3 (0.4) | 0 | 0 | 8 (1.9) | 8 (1.1) | 2 (0.9) | 2 (0.4) | 0 | 0 |
| Salmonella gr. B | 9 (1.3) | 4 (1.1) | 2 (1.3) | 24 (3.0) | 5 (1.0) | 0 | 4 (0.9) | 1 (0.1) | 0 | 1 (0.2) | 0 | 0 |
| Salmonella gr. C | 9 (1.3) | 5 (1.4) | 0 | 8 (1.0) | 2 (0.4) | 1 (0.4) | 1 (0.2) | 0 | 0 | 1 (0.2) | 0 | 0 |
| Salmonella gr. D | 5 (0.7) | 1 (0.3) | 0 | 8 (1.0) | 0 | 1 (0.4) | 0 | 3 (0.4) | 0 | 3 (0.6) | 0 | 0 |
| Salmonella gr. E | 3 (0.4) | 1 (0.3) | 2 (1.3) | 22 (2.8) | 2 (0.4) | 0 | 2 (0.4) | 3 (0.4) | 0 | 6 (1.2) | 0 | 2 (1.0) |
| Salmonella enteritidis | 0 | 1 (0.3) | 0 | 2 (0.3) | 1 (0.2) | 0 | 0 | 0 | 0 | 1 (0.2) | 0 | 0 |
| Salmonella typhi | 0 | 0 | 0 | 2 (0.3) | 2 (0.4) | 6 (2.2) | 0 | 0 | 0 | 0 | 0 | 0 |
| V. cholerae O1+S. flexneri | 0 | 0 | 0 | 2 (0.3) | 0 | 1 (0.4) | 0 | 0 | 1 (0.5) | 1 (0.2) | 0 | 0 |
| V. cholerae O1+Salmonella gr. C | 1 (0.1) | 0 | 0 | 0 | 0 | 0 | 0 | 0 | 0 | 0 | 0 | 0 |
| V. cholerae O1+Salmonella gr. B | 0 | 0 | 0 | 1 (0.1) | 0 | 0 | 0 | 0 | 0 | 0 | 0 | 0 |
| V. cholerae O1+Salmonella gr. E | 0 | 0 | 0 | 1 (0.1) | 0 | 0 | 0 | 0 | 0 | 0 | 0 | 0 |
| V. cholerae O1+S. typhi | 0 | 1 (0.3) | 0 | 0 | 0 | 0 | 0 | 0 | 0 | 0 | 0 | 0 |
| V. cholerae O1+S. enteritidis | 0 | 0 | 0 | 1 (0.1) | 0 | 0 | 0 | 0 | 0 | 0 | 0 | 0 |
| V. cholerae O1+C. jejuni | 0 | 0 | 0 | 1 (0.1) | 0 | 0 | 0 | 2 (0.3) | 0 | 0 | 0 | 0 |
| V. cholerae O1+V. parahaemolyticus | 0 | 0 | 0 | 1 (0.1) | 0 | 0 | 0 | 0 | 0 | 0 | 0 | 0 |
| Salmonella gr. B+S. flexneri | 0 | 0 | 0 | 3 (0.4) | 0 | 0 | 0 | 0 | 0 | 0 | 0 | 0 |
| Salmonella gr. D+C. jejuni | 1 (0.1) | 0 | 0 | 0 | 0 | 0 | 0 | 0 | 0 | 0 | 0 | 0 |
| S. dysenteriae+C. jejuni | 0 | 0 | 0 | 0 | 0 | 0 | 0 | 1 (0.1) | 0 | 0 | 0 | 0 |
| Total | 52 (7.7) | 29 (7.9) | 14 (8.9) | 277 (35.0) | 18 (3.6) | 19 (6.9) | 37 (8.7) | 54 (7.3) | 14 (6.4) | 61 (12.1) | 1 (0.7) | 5 (2.6) |
Other etiological agents from patients with diarrhea and controls from hospitals and CHCs
| Etiological agent | Cases | Controls | ||
| Specimens tested | Number positive (%) | Specimens tested | Number positive (%) | |
| Parasites | 389 | 43 (11.0) | 51 | 3 (6.0) |
| Ascaris lumbricoides | 6 (1.5) | 2 (4.0) | ||
| Blastocystis hominis | 22 (5.7) | 1 (2.0) | ||
| Endolimax nana | 2 (0.5) | 0 | ||
| Giardia lamblia | 3 (0.8) | 0 | ||
| Trichuris trichiura | 8 (2.1) | 0 | ||
| A. lumbricoides+G. lamblia+T. trichiura | 1 (0.3) | 0 | ||
| A. lumbricoides+T. trichiura | 1 (0.3) | 0 | ||
| Rotavirus | 539 | 202 (37.5) | 74 | 9 (12.0) |
| Adenovirus | 359 | 12 (3.3) | 33 | 0 |
| Norwalk-like virus | 278 | 49 (18.0) | 102 | 0 |
| Enterotoxigenic Escherichia coli (ETEC) | 1244 | 218 (17.5) | 184 | 23 (12.5) |
| Enterohemorrhagic E. coli (EHEC) | 690 | 7 (1.0) | 0 | 0 |
| Clostridium difficile | 154 | 2 (1.3) | 30 | 0 |
The age distribution of patients with and without diarrhea is depicted in Table 1b. More pathogens were isolated from patients over 14 years of age from both community and hospital settings. Multiple infections with bacteria were found among 18 (0.46%) of the patients (Tables 1a and 1b). Other mixed infections with bacteria were detected among 10 (0.26%) patients with parasite, two (0.05%) patients with ETEC and 11 (0.28%) patients with rotavirus (data not shown). No mixed infection was found among patients with Norwalk-like virus, adenovirus, EHEC and C. difficile (data not shown).
Further testing for parasites and viral pathogens was performed among samples in which stool samples were available, since not all the patients could present stool. Of 389 stool samples available for parasitic examination, 43 (11%) were positive, comprising Ascaris lumbricoides six (1.5%), Blastocystis hominis 22 (5.7%), Giardia lamblia three (0.8%), Trichuris trichiura eight (2.1%) and Endolimax nana two (0.5%). Multiple parasitic infections were found in two cases (0.5%) (Table 2). Of 539 stool samples processed for rotavirus, 202 (37.5%) were positive. Of the 359 stool samples processed for adenovirus, 12 (3.3%) were positive. Forty-nine of 278 (18%) stool samples processed were positive for Norwalk virus RNA. ETEC was detected in 218 (17.5%) of 1244 rectal swabs processed. A small percentage of EHEC (1%) and of C. difficile (1.3%) was also isolated (Table 2).
The seasonality of infections was analyzed for Vibrio spp., Salmonella spp. and Shigella spp. obtained from the CHCs and hospitals. In Jakarta, Indonesia, the months from September to April are cooler, rainy months; the months from May to August are hot, dry months. A high prevalence of infection by V. cholerae O1 from both CHCs and hospitals was seen in the months of May and June in the first year, and in March the second year (Fig. 1). The seasonal distribution of Shigella flexneri from the CHCs and hospitals peaked in June the first year, followed by a seasonal decline. Salmonella spp. prevalence peaked in June–August the first year, and in January–February of the second year (Fig. 1).
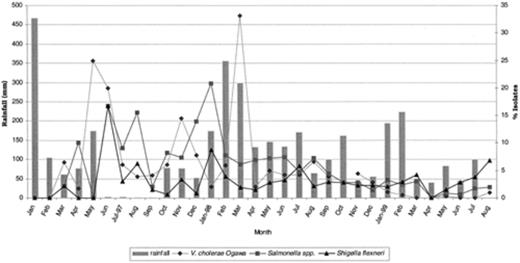
Seasonal distributions of bacterial pathogens isolated from diarrheal patients in Indonesia.
To determine the clinical features associated with bacterial pathogens, only patients with single pathogens were analyzed as shown in Table 3. Clinical symptoms associated with bacterial agents isolated from patients were watery diarrhea, followed by abdominal cramp, vomit, mucus in blood, fever, bloody stool and nausea. Patients with V. cholerae were mainly associated with watery diarrhea 101 (4.6%), vomit 89 (6.8%), abdominal cramp 95 (5.0%) and fever 34 (3.3%). For patients from which S. flexneri was isolated, 75 (3.4%) had symptoms of watery diarrhea, 38 (3.6%) displayed mucus in their stools, 26 (4.3%) had bloody stool, 48 (3.6%) had vomit and 46 (4.9%) of the patients had fever.
Clinical symptoms associated with diarrhea caused by enteric pathogens
| Isolates | Number of patients with clinical symptoms (%) | ||||||
| Watery | Mucus | Bloody | Vomit | Nausea | Abdominal cramp | Fever | |
| Vibrio cholerae O1 | 101 (4.6) | 0 | 0 | 89 (6.8) | 25 (4.9) | 95 (5.0) | 34 (3.3) |
| V. cholerae non-O1 | 5 (0.2) | 0 | 0 | 5 (0.4) | 1 (0.2) | 2 (0.1) | 2 (0.2) |
| Vibrio parahaemolyticus | 5 (0.2) | 0 | 0 | 4 (0.3) | 2 (0.4) | 5 (0.3) | 5 (0.5) |
| Shigella flexneri | 75 (3.4) | 38 (3.6) | 26 (4.3) | 48 (3.6) | 20 (4.0) | 68 (3.6) | 46 (4.5) |
| Shigella sonnei | 9 (0.4) | 3 (0.3) | 2 (0.3) | 0 | 1 (0.2) | 8 (0.4) | 5 (0.5) |
| Shigella dysenteriae | 6 (0.3) | 2 (0.2) | 2 (0.3) | 3 (0.2) | 0 | 1 (0.1) | 2 (0.2) |
| Campylobacter jejuni | 24 (1.1) | 10 (0.9) | 10 (1.7) | 10 (0.8) | 3 (0.6) | 15 (0.8) | 3 (0.3) |
| Salmonella spp. | 86 (3.9) | 34 (3.2) | 28 (4.7) | 58 (4.4) | 36 (7.1) | 75 (3.9) | 57 (5.6) |
| Salmonella typhi | 6 (0.3) | 0 | 0 | 1 (0.1) | 1 (0.2) | 3 (0.2) | 10 (1.0) |
| Others | 1896 (85.7) | 972 (91.8) | 531 (88.6) | 1099 (83.4) | 417 (82.4) | 1637 (85.8) | 861 (84.0) |
| Number of patients with diarrhea | 2213 | 1059 | 599 | 1317 | 506 | 1909 | 1025 |
The antimicrobial resistance pattern of the bacterial pathogens tested, expressed as percentage of isolates resistant, is depicted in Table 4. Antimicrobial resistance was observed in some of the bacterial isolates. Some isolates of Campylobacter were resistant to ciprofloxacin and norfloxacin. Most isolates of S. flexneri were resistant to ampicillin, chloramphenicol and tetracycline. 100% of the Shigella sonnei tested were resistant to tetracycline and 89% to sulfamethoxazole–trimethoprim (Table 4). All Campylobacter were susceptible to erythromycin, the drug of choice for treatment in Indonesia.
Antimicrobial resistance patterns of bacterial pathogens
AM, ampicillin; SXT, sulfamethoxazole–trimethoprim; C, chloramphenicol; Te, tetracycline; CF, cephalothin; K, kanamycin; CL, colistin; N, neomycin; CRO, ceftriaxone; NOR, norfloxacin; NA, nalidixic acid; CIP, ciprofloxacin; E, erythromycin; –, not done.
4 Discussion
This study, which covered a 2-year period in Jakarta, Indonesia, compared etiological agents associated with diarrhea in children and adults from hospital and community settings. The prevalence and incidence of enteric pathogens in adults were different from those in children. Diarrhea in adults was most often caused by Vibrio spp., followed by Shigella spp., in both hospital and community settings. This may have been due to the tendency of these organisms to cause severe diarrhea, thus making infected individuals more likely to seek medical attention. Other pathogens of importance in adults were Salmonella spp. and Vibrio parahaemolyticus (rarely isolated from children under 5 years old) [6]. In this study, only one infant was found to have V. parahaemolyticus. In a previous report, children under 5 years of age were most often infected with rotavirus, Shigella, Campylobacter and Salmonella spp. [15].
The results of this study implicate V. cholerae as the most frequently isolated pathogen from the hospital, compared to the community health centers. This may be because in Indonesia, patients with serious diarrhea would only go to the hospital for treatment. However, since March 1998 we have observed a decrease in the incidence of Vibrio spp. and other related pathogens. This phenomenon is very unusual in this part of the world where foods are served on the streets, with improper hygienic care. The occurrence of cholera has been shown to be a function of predisposing climatic influences such as water temperature [16]. Changes in the local sea surface temperatures brought on by such weather anomalies as the El Nino-Southern Oscillation have been suggested to be related to the spread of cholera [17]. Increases in surface temperature brought on by El Nino resulted in a doubling of the pediatric cases in Peru [18]. Less clear has been the relationship between rainfall and exposure opportunities associated with bacterial pathogens. Heavy rains leading to excessive flooding have the potential to contaminate water supplies, as has been described in numerous instances around the world [17]. By the same token, the subnormal rainfall that was seen in some months may have resulted in the reduced incidence of bacterial isolates, because of less flood. The government of Indonesia initiated a good hygiene practice program after the economic crisis of late 1997–1998. This may also have had an impact on the seasonal distribution as to why we are seeing a decreased incidence of V. cholerae in the region after 1997–1998. The reduced isolation of other pathogens irrespective of the seasonal pattern may be due to the effectiveness of the government instituted hygiene programs, which has led to a change in the food eating habits of the indigenes. All the community health centers are government supported. As a result, free visitations and free medications, such as ciprofloxacin and sulfamethoxazole–trimethoprim used in the treatment of enteric pathogens, are given free of charge or at a reduced government cost.
In Indonesia, most of the universities and CHCs including the hospitals do not normally perform routine work for bacterium- or virus-related illness. As a result, most physicians treat patients with diarrhea based solely on diarrhea symptoms and not upon the definitive identification of the cause of the diarrhea by culture identification through the method of isolation and characterization using selective and differential media. So, the etiology of diarrhea-associated pathogens revealed by this study will provide data immensely useful to planning a diarrheal disease strategy in the region. In Indonesia, diarrhea is treated with oral rehydration solution, antibiotics and feeding in some of the cases involving infants.
Multiple infections were detected in a number of patients, especially from the hospital setting. Infection with multiple pathogens has been reported previously [19,20]. Infection with multiple pathogens may reflect spurious environmental contamination, making it difficult to identify the causative agent of the diarrhea [7]. It may also be that multiple pathogens act synergistically to produce diarrheal infection, causing more of such patients to seek medical treatment.
The role of parasites in causing acute diarrhea was difficult to evaluate and may have been underestimated, since only very few stool samples were obtained and processed during the course of this study. In a previous study of Central Javanese children [21], T. trichiura, Entamoeba histolytica and G. lamblia were found to be associated with diarrhea, whereas in the present study, B. hominis, G. lamblia and T. trichiura were associated with diarrhea.
In a study in Bangladesh [22], 80% of the children were found to have serological evidence of Norwalk virus infection. In another study, enteric adenovirus and astrovirus were detected in a small number of children with acute diarrhea [23]. However, a high percentage of rotavirus was found in children in the current study. Our findings are consistent with previously published data [24].
Antimicrobial resistance was common for some bacterial pathogens. This finding may reflect the importation of new drug-resistant strains from neighboring Southeast Asian countries, although over-prescribing and inappropriate use of these antibiotics is a more likely explanation. The drug of choice for Campylobacter treatment in Indonesia is erythromycin. The quinolones are not commonly used because they are very expensive and cannot be afforded by the patients. Usually, sulfamethoxazole–trimethoprim is prescribed for all patients with diarrhea at all ages.
In this study, etiologic agents were detected more frequently among patients older than 14 years, as compared to younger patients, in both community and hospital settings. However, a previous study showed that in developing countries, the first attack of acute diarrhea occurred among children aged 0–6 months [21], initiating a recurring cycle of malnutrition and increased susceptibility to enteric infection, which ultimately leads to death. In Indonesia, it is estimated that 60–70% of diarrhea deaths are caused by dehydration. Oral rehydration in the form of prepackaged salts or home-prepared solutions are used to prevent and correct dehydration and thus prevent diarrhea-associated deaths. In some cases, both oral rehydration and antibiotics are used.
The data from this study revealed that bacteria, enteric viruses and parasitic pathogens were all important causes of gastroenteritis among indigenous Indonesians, and that infection occurred more frequently among patients older than 14 years of age. In addition, this study documents for the first time the emergence of quinolone-resistant Campylobacter spp. in Indonesia. Further studies, that will entail studying a broad spectrum of enteric pathogens in the whole archipelago of Indonesia, will be needed to determine a complete profile of enteric pathogens associated with diarrhea in both children and adults.
Acknowledgements
The contributions of the Microbiology staff (NAMRU-2), staff of Sumber Waras Hospital, Friendship Hospital and of the National Institute of Health Research and Development staff are all appreciated. This work was supported by the Naval Medical Research and Development Command (Silver Spring, MD, USA) under the work unit No. 623002A810.0101.HIX.2411. Disclaimer: The opinions and assertions contained herein are the private ones of the author and are not to be construed as official or reflecting the views of the US Navy Department of Defense, the Ministry of Health, Republic of Indonesia, Sumber Waras Hospital or Friendship Hospital.
References
